
A decision-first model can achieve high accuracy and still be unreliable in production. The missing piece is often calibration: whether the confidence scores the model reports actually correspond to the frequency of correct decisions.
If a model says 0.9 on a hundred examples and is correct on ninety of them, the score is well calibrated in that range. If it says 0.9 and is correct on only seventy, the score is over-confident. Accuracy alone does not reveal the difference. Downstream systems that set thresholds, route low-confidence cases to humans, or trigger fallbacks need the confidence numbers to mean something. When they do not, the thresholds become guesswork.
This post describes the practical calibration checks used on The Decision Bench. It does not present final calibration plots or error rates from any specific model run. Those results require a fixed dataset, a fixed model version, and a completed measurement pass. The focus here is the method.
What Calibration Means for a Decision Model
Calibration asks a simple question: when the model assigns a confidence near p, is it correct approximately p fraction of the time?
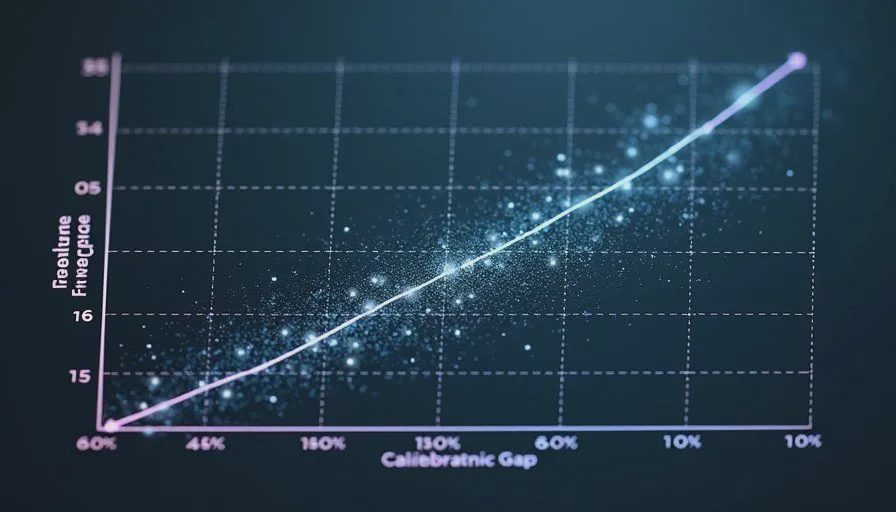
The check is performed by grouping predictions into bins according to the reported confidence (for example, 0.5–0.6, 0.6–0.7, \ldots, 0.9–1.0). Inside each bin the average confidence is compared with the empirical accuracy. A reliability diagram plots those two quantities against each other. Perfect calibration would place every point on the diagonal.
Decision-first models are especially well suited to this analysis because they already return a structured label and a score. There is no need to extract a confidence from generated text. The score that leaves the model is the score that enters the calibration calculation.
I treat calibration as conditional on the data distribution and the model version. A model that is well calibrated on a clean evaluation set can become poorly calibrated when the input distribution shifts. The measurement is therefore repeated when the data source or the preprocessing pipeline changes.
Building the Bins
The practical steps are straightforward.
Collect a set of examples that have ground-truth labels and that the model has not been tuned against. Run the model and record, for every example, the predicted label and the confidence of that label. Discard or separately analyze examples on which the model returns no score.
Divide the confidence range into bins. Equal-width bins are simple and usually sufficient for a first look. Equal-mass bins (each containing roughly the same number of examples) can be more stable when the score distribution is heavily skewed toward high values.
Inside each bin compute two numbers: the average confidence of the predictions that fell into the bin, and the fraction of those predictions that matched the ground truth. The difference between the two is the calibration error for that bin. The average of the absolute differences, weighted by bin size, is a common summary called expected calibration error.
I also keep the raw counts. A bin that contains only a handful of examples produces an unstable accuracy estimate. Reporting the count next to the accuracy prevents over-interpretation of sparse bins.

What the Reliability Diagram Shows
A reliability diagram makes the pattern visible at a glance.
Points above the diagonal indicate under-confidence: the model’s scores are lower than its actual accuracy in that range. Points below the diagonal indicate over-confidence: the scores are higher than the observed accuracy. Large deviations in the high-confidence bins are usually the most operationally important, because those are the decisions most likely to be acted on automatically.
The diagram also reveals whether the model uses the full confidence range. Some models cluster almost all predictions near 0.95–1.0 even when their accuracy does not justify it. Others spread scores more evenly. Both behaviors are visible once the points are plotted.
I record the diagram together with the model version, the dataset identifier, and the binning rule. Without those details a later reader cannot tell whether two diagrams are comparable.
Why Accuracy Can Mislead
Consider two models that both reach 85 percent accuracy on the same test set.
Model A spreads its confidence scores and is reasonably calibrated. When it reports 0.9, it is correct roughly nine times out of ten. A downstream system can set a threshold at 0.85 and expect the auto-accepted decisions to be more accurate than the overall average.
Model B also reaches 85 percent accuracy but assigns 0.95+ to almost every prediction. Its high-confidence subset is no more accurate than the overall set. A threshold based on its scores does not improve precision; it only creates a false sense of selectivity.
Accuracy treats both models as equal. Calibration shows they are not. In production the difference appears as unexpected error rates inside the auto-accepted stream or as an excessive volume of cases sent to human review.
In earlier industrial settings we saw the same pattern. A classifier could post strong offline accuracy and still generate costly false actions once its confidence numbers were trusted without a calibration check. The fix was not more accuracy; it was better alignment between reported confidence and observed frequency of correctness.
Practical Limits of a Calibration Test
A calibration measurement is only as good as the data and the conditions under which it is collected.
If the evaluation set is too small, many bins will be sparse and the reliability diagram will be noisy. If the evaluation set does not resemble production traffic, the measured calibration will not transfer. If the model is updated or the input preprocessing changes, the previous calibration numbers become outdated.
Calibration also does not measure robustness to adversarial or heavily out-of-distribution inputs. A model can be well calibrated on in-distribution data and still assign high confidence to confident mistakes on inputs that lie far from the training distribution. Those cases belong in a separate failure analysis.
Finally, calibration is not a substitute for domain-specific cost analysis. A false positive and a false negative often carry different costs. Calibration tells you about frequency of correctness inside confidence bands; it does not tell you which errors are more expensive.
How Calibration Fits the Measurement Pipeline
On The Decision Bench, calibration sits alongside accuracy, latency, and memory as a required measurement for any decision-first model that will be used with confidence thresholds.
Bench Tests posts record the method and, later, the results under stated conditions. Deploy Notes examine whether calibration holds after conversion to ONNX, quantization, or browser runtimes. Field Tests check whether the same scores remain useful inside concrete workflows such as ticket routing or content-safety filtering. Failure Log entries capture the high-confidence errors that calibration alone did not prevent.
The common requirement is that the confidence score is treated as a measurable claim rather than as an automatic guarantee. When the claim holds, the reliability diagram and the bin statistics show it. When the claim fails, the same artifacts show the failure.
Accuracy tells you how often the model is correct. Calibration tells you whether you can believe the model when it claims to be certain. Both numbers are needed before a decision-first system is ready for thresholds, automation, or production traffic.